
-April 16, 2023
These are two tools in one place. The first tool cuts the time it takes to write ads. The second tool tells you before you start a campaign whether the money will come back.
Benefits of the copy generator
Writing an ad takes a few seconds instead of hours
You get four different styles for one product so you can pick the best
Every copy gets a score
You see the character limit of each platform
Words that can get an ad rejected show up in advance
Copy can be made in fifty languages
Benefits of the ROI predictor
You know the result before you spend the budget
A losing campaign is caught before it starts
You learn the break-even point which is the least income you need
Decisions to raise or cut the budget rest on numbers and not guesses
You can show real figures to a client or a boss
First step
Write the product name and a short description. For example eco friendly water bottle for athletes. The clearer you are the better the copy will be.
Second step
Choose the target audience. These are the people you want to show the ad to. For example students or parents or gamers.
Third step
Choose the tone. Energetic suits young people. Professional suits business buyers. Urgent suits a sale. Emotional suits family products.
Fourth step Choose the platform. This matters because each platform has its own length limit. Google Ads gives very little space. Instagram gives a lot.
Fifth step Choose the goal. Sales means getting people to buy right away. Leads means getting them to fill a form. Awareness means just making your name known. App install means getting people to download your app.
Sixth step Choose the language and press Generate.
Seventh step Read all four copies. Under each copy you will see:
The framework name which is the writing method used
The score which shows how strong it is
The character count which shows if it fits the limit
Hashtags
A copy button
The copy with the highest score shows up with a green border.
Eighth step If a red warning appears change that word. The warning means Facebook or Google may block that ad.
Ninth step Press the copy button and paste the text into your ad manager.
First step: Choose your currency at the top.
Second step
Set the monthly ad spend which is your budget for the month.
Third step: Set the cost per click. This is the money spent on each click. Check your old campaigns for it. If you have none make an estimate.
Fourth step: Set the conversion rate. This tells you how many people out of a hundred clicks end up buying. Two to three percent is a safe guess for most shops.
Fifth step
Enter the average order value which is how much one customer spends in one purchase.
Sixth step: Enter the profit margin which is the share you keep after selling. This is the part people forget most often.
Seventh step Read the results.
Projected ROI\How much more you earned compared to what you spent. Higher is better.
Estimated revenue
Total sales you can expect.
ROAS
How much money comes back for every one rupee spent.
CPA
What it costs you to win one customer.
Net profit The real saving after product costs are removed.
Break-even ROAS The least ROAS you need or else you lose money.
What the colors mean
Green means profit
Yellow means no loss and no gain
Red means loss
Budget double
See what happens if you double the budget. Remember that click costs rise when the budget is bigger. So profit does not always double.
Conversion plus half
See how much a better landing page would change things.
Reset
Go back to your original numbers.
The chart below shows how income changes as spending grows. If the two lines keep moving apart then scaling up pays off.
First step: Start with the ROI tool and enter your estimates. If the result is red change your plan before making any ads.
Second step
If the result is green go to the copy generator and make four copies.
Third step
Pick the two best copies and run each as a separate ad. This is called an A/B test.
Fourth step
After a few days check which copy brought more clicks. Move more budget to the winner.
Fifth step
When real numbers come in put them back into the ROI tool and see if your estimate was right.
Be very clear in the product description
Use your real numbers in the ROI tool and not wild guesses
Always enter the correct margin or the net profit will be wrong
Do not rely on a single copy and always run at least two
Change any word that gets a warning
Read the AI copy yourself once and adjust it to match your brand
If this plugin is installed on your WordPress site visitors only need to open the page that holds the shortcode. Colors and titles and default numbers can be changed from Settings under Ad Toolkit. To get copy in fifty languages you must add an Anthropic API key.
Running one copy and waiting for results
Looking only at revenue and ignoring margin
Setting the conversion rate too high
Keeping a word that shows a warning
Ignoring the platform length limit
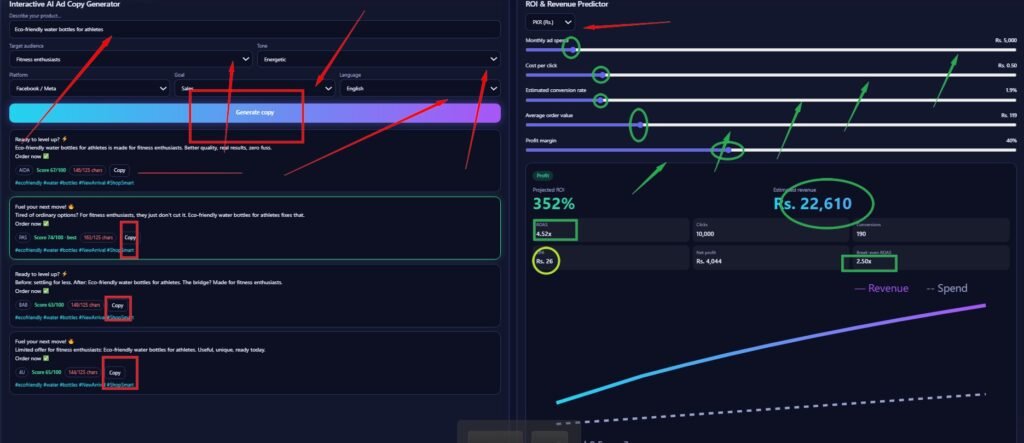
This guide follows the marks you drew on your screenshot. Each red and green mark is explained in the order it appears.
Product box (top red arrow)
Type your product name and a short description here. The tool builds every copy from this line. A clear line gives a better result. Your screen shows eco friendly water bottles for athletes.
Target audience and Tone (red arrows on the dropdowns)
Audience tells the tool who will see the ad. Tone sets the mood of the writing. Your screen uses fitness enthusiasts with an energetic tone. That is why the hooks say things like ready to level up.
Platform and Goal (arrows on the second row)
Platform sets the character limit. Goal sets the call to action at the end. Your screen uses Facebook with sales so every copy ends with order now.
Language (arrow on the right)
This sets the language of the copy. English works for everyone. Other languages need the AI key to be set.
Generate copy button (big red box)
Press this after you set all the choices above. Four fresh copies appear below it. Press it again after any change to get new versions.
Each card is one copy written with one method.
AIDA grabs attention and then builds interest and desire and ends with action
PAS names a problem and then offers the fix
BAB shows life before and after and the bridge between them
4U pushes a limited and useful offer
Score
The number next to each method shows how strong the copy is. The card with the best score gets a green border and the word best. In your screenshot the PAS card is the winner.
Character count (red pills)
This shows how long the copy is against the platform limit. Red means the copy is too long for that platform. In your screenshot all four copies are in red so they are over the Facebook limit. Shorten the text before using it as a headline. Longer text can still work as a main post text because Facebook cuts it with a see more link.
Copy buttons (red boxes)
Press Copy on the card you like. The text and hashtags go to your clipboard. Then paste it into your ad manager.
Hashtags (blue line under each card)
These are built from your product words. Remove any that do not fit your brand.
Currency dropdown (red arrow at the top)
Pick the money symbol you want. Only the symbol changes. The numbers stay the same.
Sliders (green circles)
Drag each slider to set your own numbers.
Monthly ad spend is your budget for the month
Cost per click is what you pay for each click
Estimated conversion rate is the share of clickers who buy
Average order value is what one customer spends
Profit margin is the share you keep after costs
Change one slider at a time and watch how the results move. This shows you which number matters most.
Profit badge
Green with the word Profit means the campaign earns more than it costs. Yellow means break even. Red means loss.
Projected ROI (large green number)
This is how much extra you earn compared to what you spend. A higher number is better.
Estimated revenue (green circle on the right)
This is the total sales the campaign should bring in.
ROAS (green box)
This is how many rupees come back for every one rupee spent. Compare it with the break even box next to it.
Break even ROAS (green box on the right)
This is the least ROAS you need to avoid a loss. Your ROAS should stay above this number. In your screenshot it does so the badge shows Profit.
CPA (yellow circle)
This is what it costs to win one customer. Keep it well below the profit you make on one sale.
Net profit
This is what you really keep after ad spend and product costs.
Clicks and Conversions
These show how many people click and how many of them buy.
The purple blue line is revenue. The dotted line is spend. The chart shows what happens when you raise the budget from low to high. When the revenue line stays far above the dotted line scaling up pays off. When the lines come close together more spending stops being worth it.
First set the sliders on the right and check that the badge is green. Then go to the left side and choose your audience and tone and platform. Press Generate copy. Pick the best scored card and one more as a backup. Shorten any copy that shows red characters. Press Copy and paste each one into a separate ad so you can test them against each other.
All copies are in red so shorten the product line or use a platform with a bigger limit like InstagramHashtags look generic so replace them with ones your buyers really search
The campaign shows profit so test a small budget increase and watch whether ROAS stays above break even

Third Sub Title
New Page Sub Title
Lorem ipsum dolor sit amet, consectetur adipiscing elit. Ut elit tellus, luctus nec ullamcorper mattis, pulvinar dapibus leo.
Who Are We
Our Mission
Awards
Experience
Success Story
Who Are We
Our Mission
Awards
Experience
Success Story


© 2023 Created with Royal Elementor Addons
